Hello class, my name is Professor Montgomery and today we will be learning about the concepts of mean, median, and mode. These concepts are very important because they are used in math when trying to find an average in a set of numbers, the middle number in a set of numbers. and the most common number in a set.
To teach these concepts I will use an example of a random set of numbers:
Using this set of numbers we will find the mean, median, and the mode.
2, 2, 2, 4, 4, 5, 6, 6, 7, 9, 9
First, to find the median you must cross out the numbers starting at the highest then jumping to lowest, then back to the next highest, until there is one number left.
In this case, the number that is still left after this process is 5. Therefore 5 is the median.
Next, to find the mode, look at the set of numbers and see which number appears the most number of times. In this case, the mode is 2 because it appears three times, which is more frequently than any other number.
Lastly, to find the mean, which also means the average, you must add up all of the numbers in the set and divide the result by the amount of numbers in the set.
For this example, we would add up 2 + 2 + 2 + 4 + 4 + 5 + 6 + 6 + 7 + 9 + 9 which equals 56.
Then we will divide 56 by 11 (which is the number of numbers in the set).
This equals 5.0909090909 which I would round to about 5.1.
Now we're done!
.

Thursday, December 10, 2015

Margot Hudson
December 10, 2015
Q. Reasoning and Mathematical Skills
Blog 4: Be the Professor
I'm going to explain the topic of Sets.
A set is a collection of something (objects, numbers, etc.).
Elements are members of the set.
There are two types of sets: Well-defined and subjective
A well-defined set is a set for which there is a way of determining whether or not an item is an element of the set; subjective means that there is no way to determine whether or not an item is an element of the set.
There are also different notations for writing out sets.
One of those notations is Set Builder Notation which determines whether or not an object is an element of the set rather than actual elements.
Ex) B= {Boy | the boy who cried wolf}
A universal set is the set of all elements.
Ex) A= the set of all musical artists that are female
In this case "A" is the universal set.
A subset is for every element in set A the subset follows that element.
A cardinal number (cardinality) is the number of all elements in the set
-denoted n(A)
An empty set is always the subset of the universal set
December 10, 2015
Q. Reasoning and Mathematical Skills
Blog 4: Be the Professor
I'm going to explain the topic of Sets.
A set is a collection of something (objects, numbers, etc.).
Elements are members of the set.
There are two types of sets: Well-defined and subjective
A well-defined set is a set for which there is a way of determining whether or not an item is an element of the set; subjective means that there is no way to determine whether or not an item is an element of the set.
There are also different notations for writing out sets.
One of those notations is Set Builder Notation which determines whether or not an object is an element of the set rather than actual elements.
Ex) B= {Boy | the boy who cried wolf}
A universal set is the set of all elements.
Ex) A= the set of all musical artists that are female
In this case "A" is the universal set.
A subset is for every element in set A the subset follows that element.
A cardinal number (cardinality) is the number of all elements in the set
-denoted n(A)
An empty set is always the subset of the universal set


Wednesday, December 9, 2015
Professor Wright : Mean, Median, Mode
My name is Professor Wright and today I am going to teach you about mean, median, and mode.
Mean : Mean is the average that is within your data set, which is found by dividing up the sum of the data by the total number of data points.
It can be represented as

Example: Data set: 2, 3, 4, 4, 5, 5, 6, 6, 8, 10
2+3+4+4+5+5+6+6+8+10= 53
10 total numbers in data set
53/10
mean= 5.3
Median: The middle value in the data set.
First you must arrange the data set in least to greatest, then find the value in the middle of the set.
If there are odd amount of numbers than there is one median.
If there are an even amount of numbers there are two middle values and then you just take the average of them.
Example:
2, 3, 4, 4, 5, 5, 6, 6, 8, 10
there are an even amount of numbers so ..
5+5=10 divide by 2. = 5
median= 5
Mode:
The most common value in the data set
4, 5, 6 are the most common values in the data set because they all appear twice.
By: Samantha Wright
Mean : Mean is the average that is within your data set, which is found by dividing up the sum of the data by the total number of data points.
It can be represented as
Example: Data set: 2, 3, 4, 4, 5, 5, 6, 6, 8, 10
2+3+4+4+5+5+6+6+8+10= 53
10 total numbers in data set
53/10
mean= 5.3
Median: The middle value in the data set.
First you must arrange the data set in least to greatest, then find the value in the middle of the set.
If there are odd amount of numbers than there is one median.
If there are an even amount of numbers there are two middle values and then you just take the average of them.
Example:
2, 3, 4, 4, 5, 5, 6, 6, 8, 10
there are an even amount of numbers so ..
5+5=10 divide by 2. = 5
median= 5
Mode:
The most common value in the data set
4, 5, 6 are the most common values in the data set because they all appear twice.
By: Samantha Wright
Tuesday, December 8, 2015
blog 4- compound interest!
Hi!
I'm professor Ali and I am going to teach you an easy lesson about compound interest today that I wish I had payed more attention to when I was younger.It is a simple way to learn how to invest money for long periods- it's in your best interest!
just remember this simple formula:
FV= PV x (1+r)^n
FV is your future value
PV is your present value (the money you are originally investing)
r is the annual interest rate that the bank is offering
n is the period of time (in years unless compounded monthly)
Using this formula, gather information from banks and plug in their offers to the according letters.
This way, you can compute which offer will get you the highest future value
This way, you can compute which offer will get you the highest future value
Here are some examples--
If you have $1000 and the bank is offering a loan for 5 years at 6% interest...
1000 x (1 + .06)^5 = $1338.23
----------> the percentage is seen as .06 because in order to turn a percentage into a decimal, you must move the decimal point to the left two spots
If the bank offers a loan for 15 years at 10% interest...
1000 x (1 .15)^15 = $4177.25
Now it is up to you how long you want to invest your money, depending on your goal future value!
----------> the percentage is seen as .06 because in order to turn a percentage into a decimal, you must move the decimal point to the left two spots
If the bank offers a loan for 15 years at 10% interest...
1000 x (1 .15)^15 = $4177.25
Now it is up to you how long you want to invest your money, depending on your goal future value!
Blog 4 - Fundamental Principle of Counting
Hello class, my name is professor Bradley; today I will be teaching you about Fundamental Principle of Counting. Fundamental Principle of Counting can be used anywhere, it just depends on how it's used. But before we go into learning about some of its real-world applications, we need to first understand what Fundamental Principle of Counting is.
Fundamental Principle of Counting is a way to figure out the total number of ways different events can occur.
Fundamental Principle of Counting:
Event M: m ways
Event N: n ways
m x n ways
Multiplying one event by another can provide all the possible outcomes of that specific event.
( E1 x E2)
Events can also be viewed as combinations, such as ordering fast food, picking out different combinations of clothes, and more.
Example:
There was a boy named little Jimmy, little jimmy was very hot and was desperately craving for ice cream, so he decided to go to Baskin-Robbins. Little jimmy was very overwhelmed with the many different varieties of ice cream that he could choose from, nevertheless he had the choice of what the ice cream came in, cup or cone.
Cup:
Small, Medium, Large
Cone:
Cake cone, Fresh- baked waffle cone, Sugar cone, Classic cone
Ice Cream Flavors:
Oreo Cool Mint Chocolate ice cream
Berry Passion frozen yogurt
Black Walnut ice cream
Cherries Jubilee ice cream
Chocolate Almond ice cream
Chocolate Chip Cookie Dough ice cream
Chocolate Chip ice cream
Chocolate Fudge ice cream
Chocolate ice cream
Creole Cream Cheese ice cream
Daiquiri Ice
Dunkin Donuts Coffee Coffee Chip ice cream
Egg Nog ice cream
Fat-Free Vanilla frozen yogurt
Fudge Brownie ice cream
German Chocolate Cake ice cream
Gold Medal Ribbon ice cream
Icing on the Cake ice cream
Jamoca Almond Fudge ice cream
Jamoca ice cream
Lemon Custard ice cream
Made with Snickers ice cream
Mint Chocolate Chip ice cream
Mom's Makin' Cookies ice cream
New York Cheesecake ice cream
Nutty Coconut ice cream
Old Fashioned Butter Pecan ice cream
OREO Cookies 'n Cream ice cream
OREO Malt Madness ice cream
Peanut Butter 'n Chocolate ice cream
Peppermint ice cream
Pistachio Almond ice cream
Pralines 'n Cream ice cream
Premium Churned Reduced-Fat, No Sugar Added Caramel Turtle Truffle ice cream
Premium Churned Reduced-Fat, No Sugar Added Pineapple Coconut ice cream
Pumpkin Pie ice cream
Quarterback Crunch ice cream
Rainbow Sherbet
Rasberry Sinceri-Tea ice cream
Reese's Peanut Butter Cup ice cream
Rocky Road ice cream
Rum Raisin ice cream
S'More the Merrier ice cream
Strawberry Cheesecake ice cream
Vanilla ice cream
Very Berry Strawberry ice cream
Wild 'n Reckless Sherbet
Winter White Chocolate ice cream
World Class Chocolate ice cream
Little jimmy was curious about how many different combinations there were, so he used the fundamental principle of counting.
3(Cup) x 4(Cone) x 49(Flavors)= 588
Little jimmy has 588 combinations to choose from.
Well that's it for class today, I appreciate your attention and I hoped you have a full understanding of how to use the Fundamental Principle of Counting.
Fundamental Principle of Counting is a way to figure out the total number of ways different events can occur.
Fundamental Principle of Counting:
Event M: m ways
Event N: n ways
m x n ways
Multiplying one event by another can provide all the possible outcomes of that specific event.
( E1 x E2)
Events can also be viewed as combinations, such as ordering fast food, picking out different combinations of clothes, and more.
Example:
There was a boy named little Jimmy, little jimmy was very hot and was desperately craving for ice cream, so he decided to go to Baskin-Robbins. Little jimmy was very overwhelmed with the many different varieties of ice cream that he could choose from, nevertheless he had the choice of what the ice cream came in, cup or cone.
Cup:
Small, Medium, Large
Cone:
Cake cone, Fresh- baked waffle cone, Sugar cone, Classic cone
Ice Cream Flavors:
Oreo Cool Mint Chocolate ice cream
Berry Passion frozen yogurt
Black Walnut ice cream
Cherries Jubilee ice cream
Chocolate Almond ice cream
Chocolate Chip Cookie Dough ice cream
Chocolate Chip ice cream
Chocolate Fudge ice cream
Chocolate ice cream
Creole Cream Cheese ice cream
Daiquiri Ice
Dunkin Donuts Coffee Coffee Chip ice cream
Egg Nog ice cream
Fat-Free Vanilla frozen yogurt
Fudge Brownie ice cream
German Chocolate Cake ice cream
Gold Medal Ribbon ice cream
Icing on the Cake ice cream
Jamoca Almond Fudge ice cream
Jamoca ice cream
Lemon Custard ice cream
Made with Snickers ice cream
Mint Chocolate Chip ice cream
Mom's Makin' Cookies ice cream
New York Cheesecake ice cream
Nutty Coconut ice cream
Old Fashioned Butter Pecan ice cream
OREO Cookies 'n Cream ice cream
OREO Malt Madness ice cream
Peanut Butter 'n Chocolate ice cream
Peppermint ice cream
Pistachio Almond ice cream
Pralines 'n Cream ice cream
Premium Churned Reduced-Fat, No Sugar Added Caramel Turtle Truffle ice cream
Premium Churned Reduced-Fat, No Sugar Added Pineapple Coconut ice cream
Pumpkin Pie ice cream
Quarterback Crunch ice cream
Rainbow Sherbet
Rasberry Sinceri-Tea ice cream
Reese's Peanut Butter Cup ice cream
Rocky Road ice cream
Rum Raisin ice cream
S'More the Merrier ice cream
Strawberry Cheesecake ice cream
Vanilla ice cream
Very Berry Strawberry ice cream
Wild 'n Reckless Sherbet
Winter White Chocolate ice cream
World Class Chocolate ice cream
Little jimmy was curious about how many different combinations there were, so he used the fundamental principle of counting.
3(Cup) x 4(Cone) x 49(Flavors)= 588
Little jimmy has 588 combinations to choose from.
Well that's it for class today, I appreciate your attention and I hoped you have a full understanding of how to use the Fundamental Principle of Counting.
Blog #4
Hello Class, today we will be learning about different types of graphs. Graphs are visual aids used to represent a set of data in a word problem.



- One type of graph is a bar graph. These graphs can be shown horizontally or vertically. These graphs are usually helpful for comparing two or more sets of data.
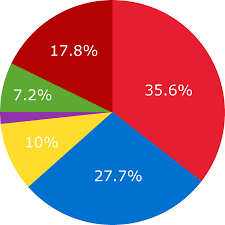
- Another graph is called a circle graph, or a pie chart. The data is divided into "slices" of the pie and paired with a color.
- Another type of graph is a line graph. This is when the data in the word problem is plotted on a graph with an (X,Y) coordinates.

- The last type of graph is a histogram which is almost like a bar graph but a little different. Unlike a bar graph a histogram the bars must be touching, and the data must be put in order on the graph.
Example #1. In the last ten years vinyl record sales have increased. Using the data below make a line graph.


Subscribe to:
Posts (Atom)